The Halo Effect
For every $1.00 in a religious congregation's annual budget, a city gets an estimated $3.39 of benefits.
The Halo Calculator is an estimating tool. It does not represent a formal research result. Learn more about our data.
How much does your city benefit from the Halo Effect?

How to use the Halo Calculator
Enter one of the following variables to find the corresponding estimated Halo Effect of a congregation or region:
Name of congregation, city, or province
Postal code or portion thereof
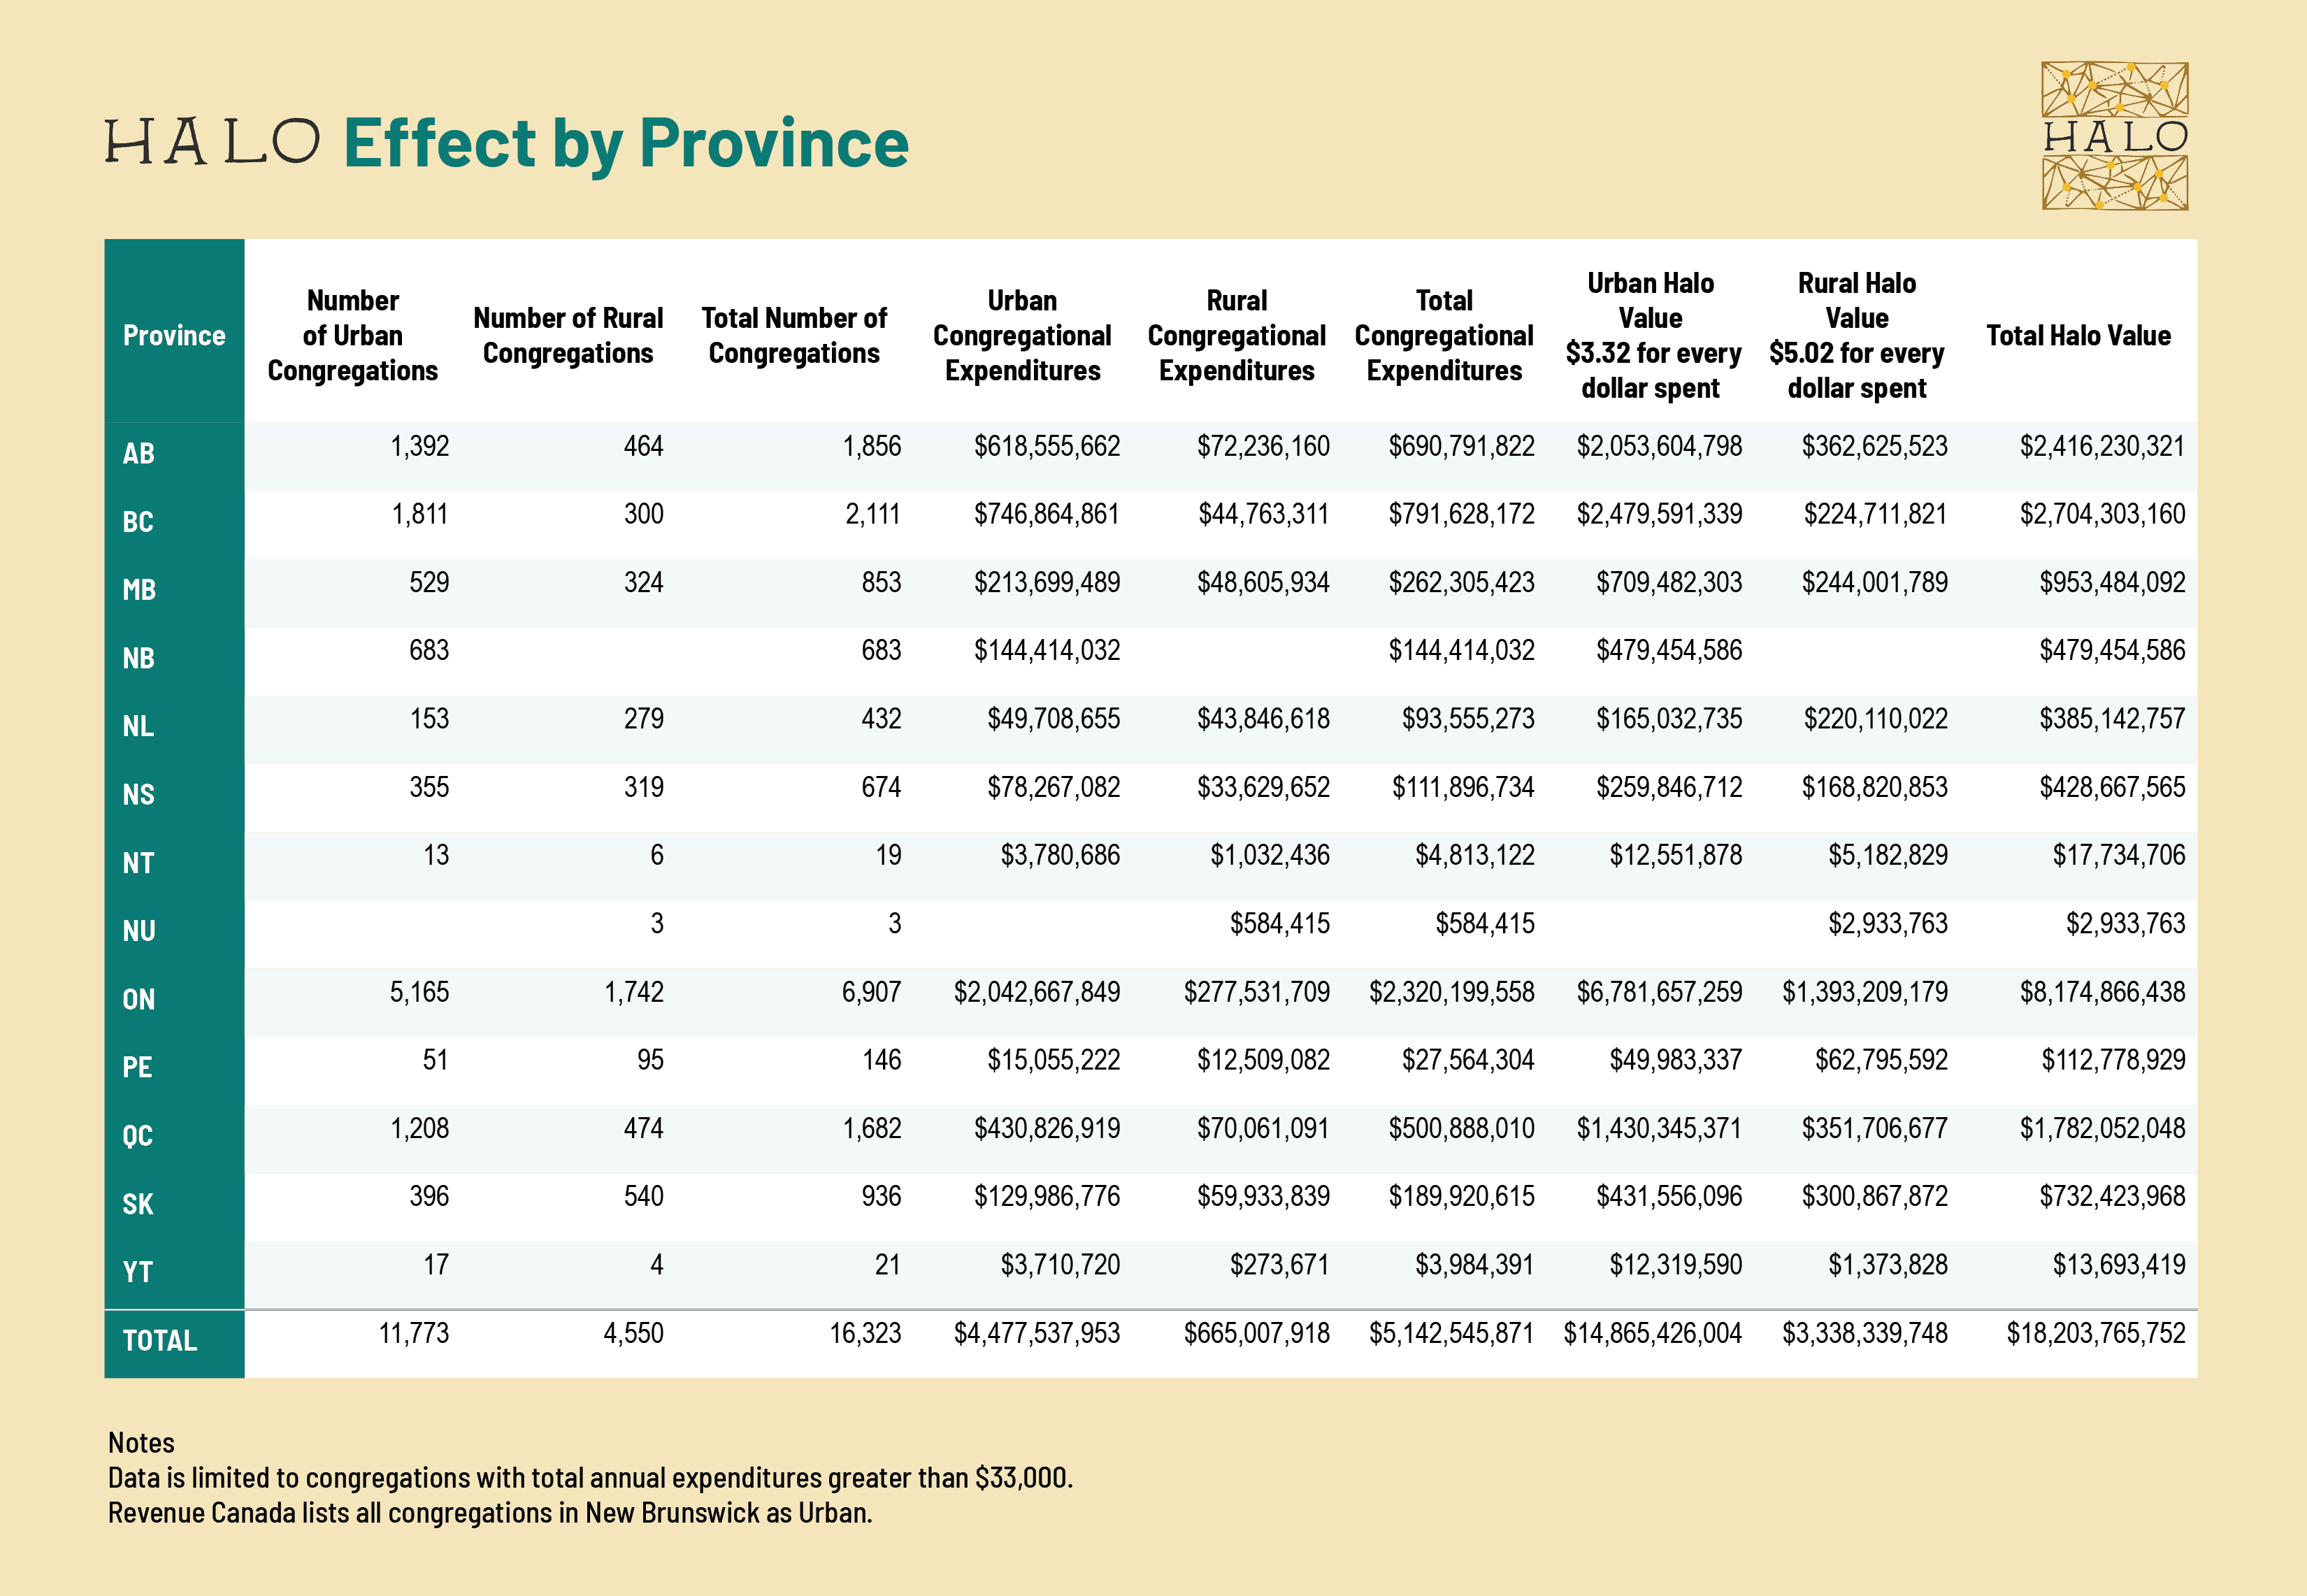
Note: Revenue Canada lists all congregations in New Brunswick as urban.
The Halo Calculator is a project of Cardus and is intended as an estimating tool. The most recent work on the Calculator was done in 2022 by researchers Mike Wood Daly and Goran Perkić.
What is Halo Effect?
Halo Effect is a measure of the socio-economic benefit that a religious congregation contributes to its local community.
Halo Effect is expressed as a multiplier. This multiplier is determined by our research methodology (described below). Based on the most recent research, the multiplier is $3.39. This means that for every dollar that a congregation spends, the local community on average receives $3.39 in economic benefit.
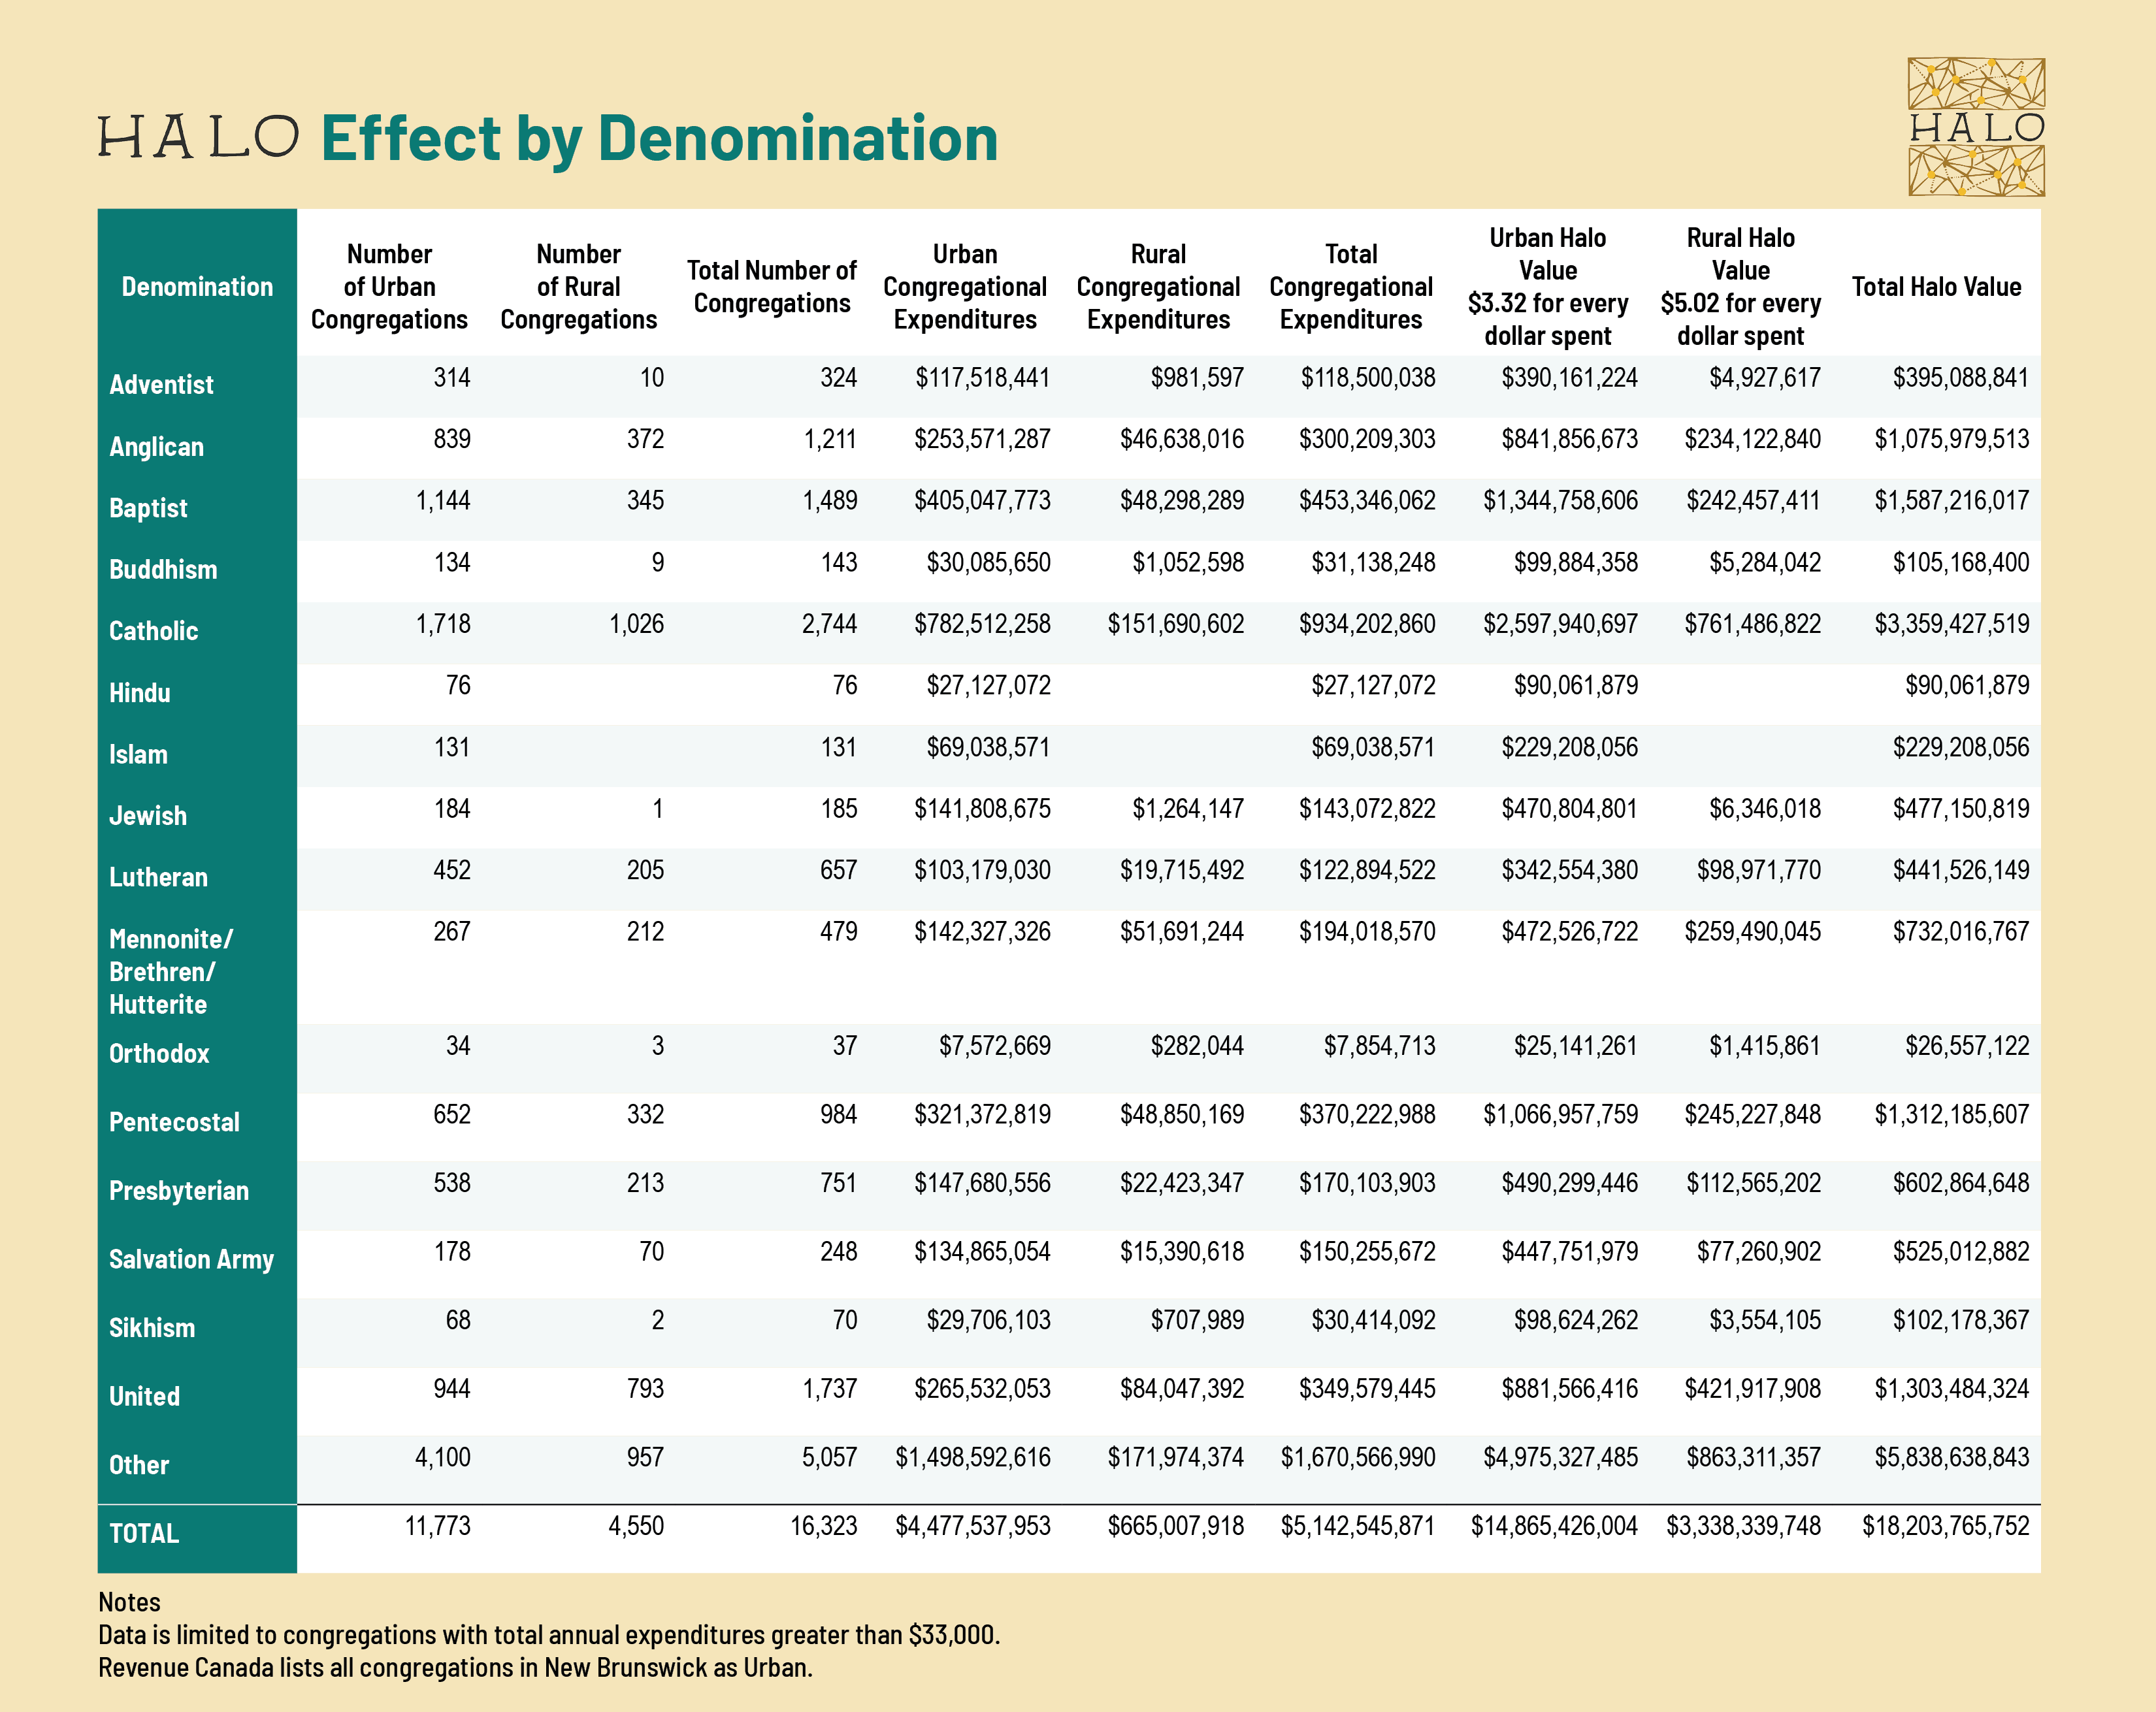
This $3.39 represents the median nation-wide value. For rural congregations, the median value is $5.02. For urban congregations, it is $3.32.
Halo Effect for Canada as a whole is currently estimated to be $18.2 billion. Although religious congregations do not exist for the purpose of benefiting the economy, their economic benefit is in fact significant. Furthermore, if governments or other agencies had to replace the programs and services that congregations provide to their local communities, the cost would be immense.
What is the research methodology?
The first Halo study was conducted by Partners for Sacred Places and the University of Pennsylvania’s School of Social Policy and Practice. Researcher Ram Cnaan and colleagues created a “value matrix” to quantify the economic contribution of twelve congregations in Philadelphia.
Further research extended the study to ninety congregations in three US cities: Philadelphia, Chicago, and Fort Worth. See “The Economic Halo Effect of Historic Sacred Places.” Partners for Sacred Places, 2016.
Cardus used the same methodology, with some adjustments for the Canadian context.
The value matrix quantifies a congregation’s economic contribution according to 41 variables grouped into seven broad areas:
open space (e.g., recreational use)
direct spending
educational programs (e.g., a daycare on site)
magnet effect (e.g., spending by visitors attending weddings, funerals, etc.)
individual impact (e.g., helping immigrant and refugee families settle in Canada; marriage and family counseling)
community development (e.g., job-training, housing initiatives)
social capital and care (e.g., programs that benefit people in the surrounding community, volunteer activities, food banks)
For details, please see Mike Wood Daly, “Valuing Toronto’s Faith Congregations,” Cardus, 2016.
Where does the Calculator’s data come from?
Our current research reveals that a congregation’s direct spending accounts for 26 percent of its Halo Effect, on average. Thus, if we know how much the congregation spends, we can estimate its overall Halo Effect.
To obtain the data on congregational spending, we turned to the T3010 Registered Charity Information Return that congregations submit to the Canada Revenue Agency.
To filter out the charities that are not congregations, we used only the subset identified as “E1 — Places of Worship.” We further filtered out entries that we could identify by their names as being diocesan offices, schools, camps, or other non-congregations. It is possible that some non-congregations remain in the data set.
Because not every congregation submits a form every year, we used the most recent T3010 for that congregation from years 2017 to 2019. (We used 2019 as the latest year in order to avoid any impact from the Covid-19 pandemic, and because some charities are slow to submit their data.) If the congregation did not submit a form in one of those years, we omitted that congregation from the database.
Also, if a congregation reported an annual budget of less than $33,000, we omitted that congregation. $33,000 is one half of the average salary of a Christian minister, according to survey data from the Canadian Centre for Christian Charities. (For the purpose of this data point, we assumed that the average salary of congregational leaders is similar across all faith traditions.) Our thinking was that if a congregation does not have at least a half-time employee, it is too small to include in our database.
There are 20,400 congregations in the database.
A previous version of the Calculator used a multiplier of $4.77. Why did it change?
The $4.77 multiplier was the result of our study of ten congregations in the Toronto area in 2016. As we stated then, it was a first-phase study. Our purpose was to explore the suitability of the methodology to the Canadian context. We expected that further study of a larger number of congregations, and in a wider geographic area, would produce a more refined result.
This latest iteration is based on a study of 76 congregations across Canada, conducted in 2020 by researcher Mike Wood Daly, and on further research of 100 congregations, which has not yet been published. For the 2020 study, see Mike Wood Daly, “Dollars and $ense: Uncovering the Socio-Economic Benefit of Religious Congregations in Canada.” Studies in Religion49, no. 4 (2020): 587 – 610.
What else is new with this version of the Calculator?
The Calculator’s underlying data is more accurate. As noted above, we sought to omit all entries that were not congregations, and we omitted congregations that reported expenditures of less than $33,000.
We now have a median value for urban impact and rural impact. Each congregation was categorized as either urban or rural, based on distinctions provided by Revenue Canada.
You can zoom in and out on the map, and can search by various criteria. Each congregation’s geo-coordinates were added to the database.
What are the limitations to the methodology?
Some variables in the value matrix depend on self-reporting by the congregations.
The number of congregations (76) reported on in the most recently published material is still small. It is possible that a larger sample would result in an adjusted Halo multiplier.
The Halo Effect does not account for any negative economic impact (that is, increased expense to the community) that a congregation might cause.
The result that the Calculator returns for any given congregation should be taken as an estimate only. In order to know the actual Halo Effect, that congregation would need to use the value matrix and apply its own data to each variable.
What related projects has Cardus done?
Kendra Fry and Milton Friesen. “No Space for Community: The Value of Faith Buildings in the Effect of Their Loss in Ontario.” Faith and the Common Good, 2020. Cardus participated in this study that sought to measure the socio-economic impact that would be experienced in a community if it could no longer use a congregation’s building.
Brian J. Grim and Melissa E. Grim, “The Hidden Economy: How Faith Helps Fuel Canada’s GDP.” Cardus, 2020. This study sought to measure religion’s contribution to Canada’s economy overall.
My congregation would like a formal determination of its own Halo Effect. How can we do that?
Cardus is not currently doing any studies of individual congregations. However, you might wish to inquire with the Halo Canada Project, which is a separate organization.